I've been continuing on my learning physics quests, currently alternating between electromagnetics and waves. I was reading chapter 2 of French's "Vibrations and Waves" and he talked there about Lissajous curves.
These are 2d curves whose x-y coordinates are parametrized by cosines, ie
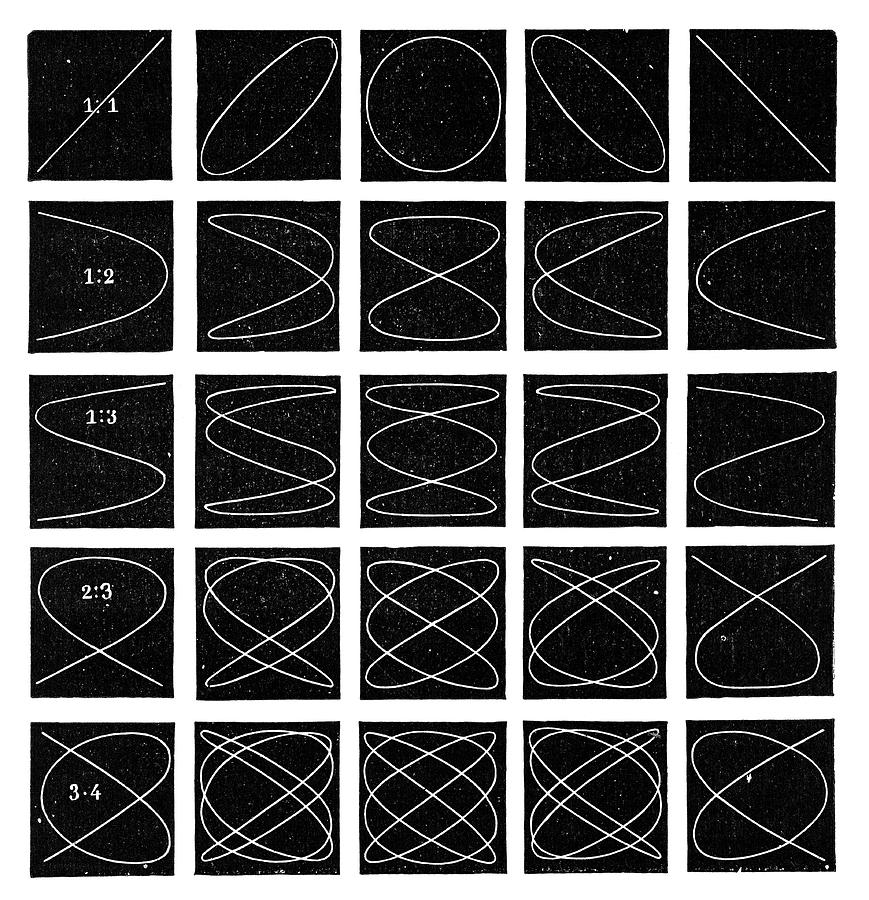
We can deduce that the curves are bounded in a rectangle of sides \(2A_x, 2A_y\). In general for arbitrary frequencies, the curves can be quite chaotic and infact it can be shown that if the frequencies don't satisfy a kind of integer relationship
then the curves never repeat themselves. When the frequencies have simple integer ratios though, the curves can be quite aesthetic, as seen in the image above.
In the book they have this cool figure,
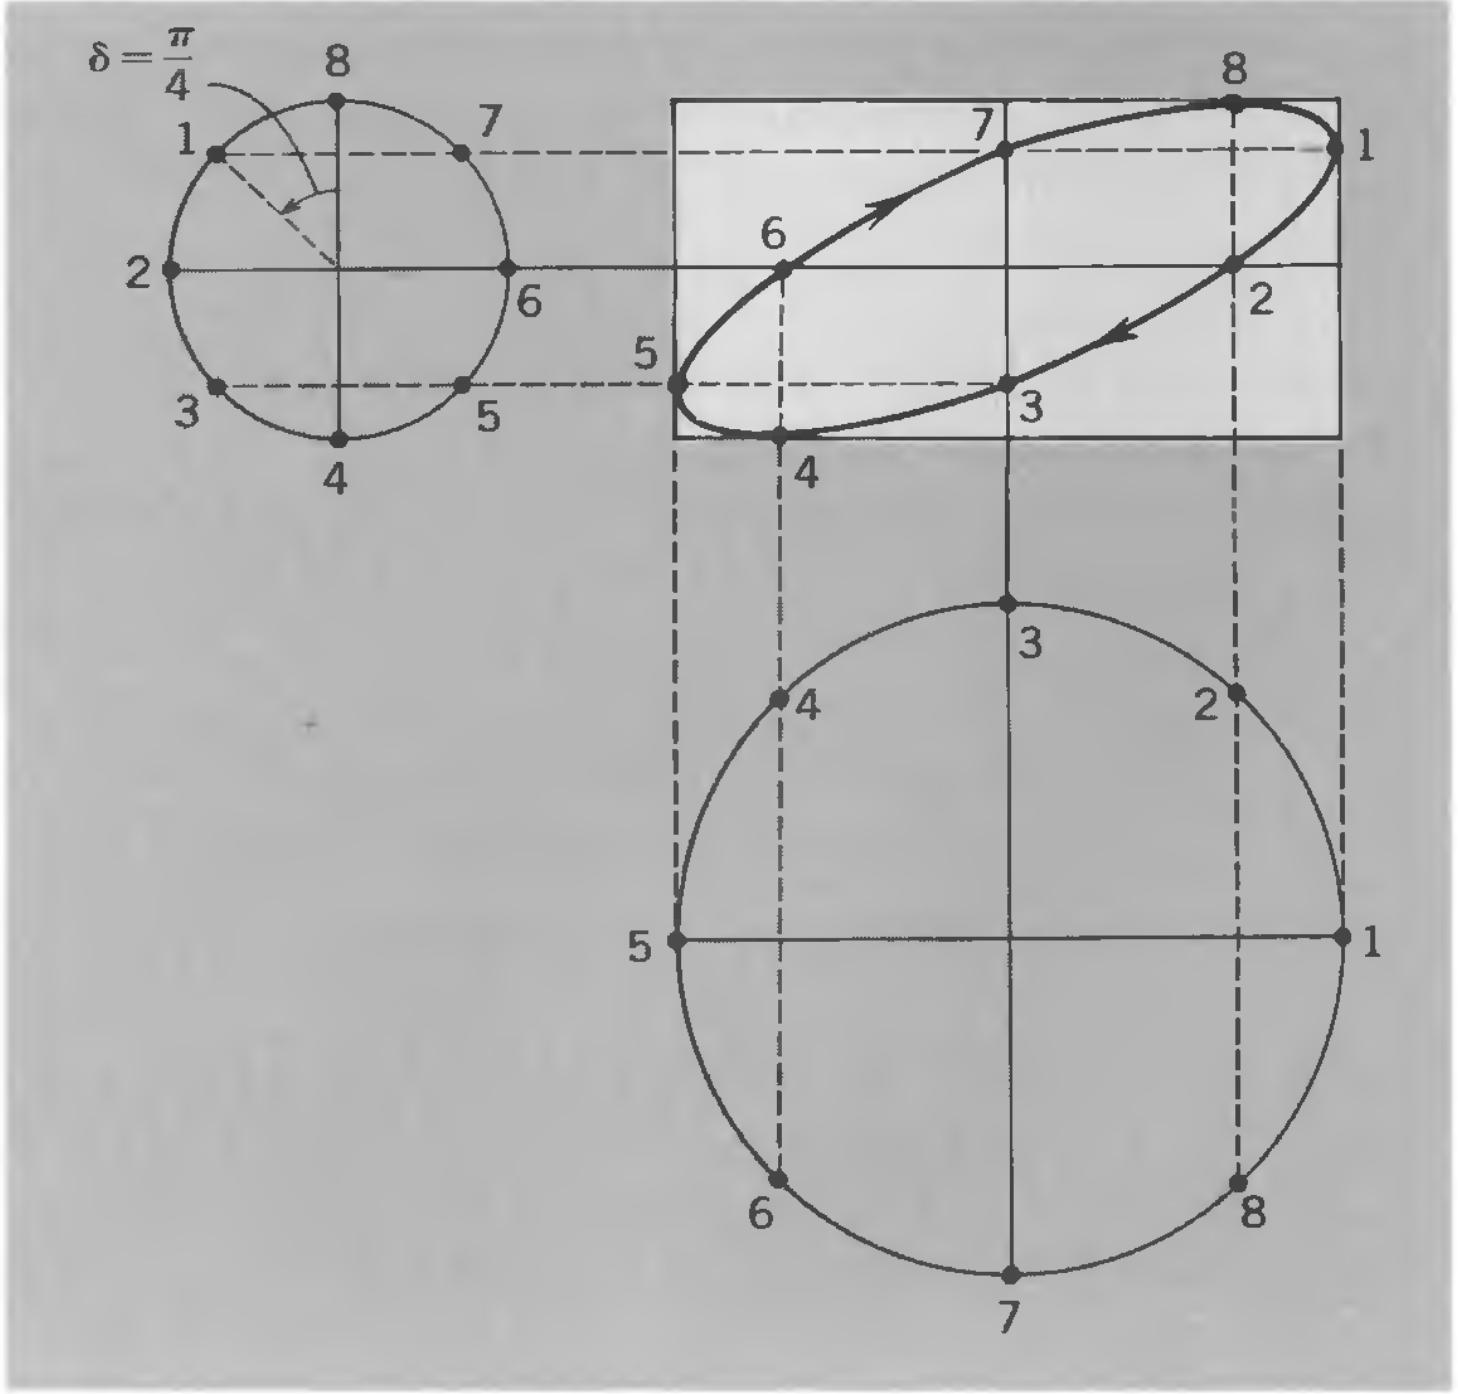
And I figured (no pun intended) it would be fun to write an interactive version. p5.js is a neat javascript library that can handle this. I even found this example which gave me a really convenient starting point.
So, Without further ado,